WRTC-2018 Statistics
After every WRTC Game, people are always interested in statistics.
I'm not sure why. Bragging Rights ???
Which Radios did the winners use? Which Logging Software? Etc., etc., etc.,
This time, considering the lousy condx of the bands and the heatwave currently in the northern hemisphere, I guess there is nothing better to do than to look at statistics.
With this in mind, I have sorted a bunch of data in several Excel Spreadsheets.
If any cares to take this even farther, go ahead, then send it to me and I will post it here.
In the following Excel document, there are individual sheets listing the 63 teams, according to:
- Final Placing
- Number of CW QSOs
- Number of SSB QSOs
- Number of DXCC Multipliers
- Number of HQ Station Multipliers
- Software used for Logging
- Type of Radios Used (this one is a bit difficult)
DOWNLOAD THE STATISTICS:
Sheets of Statistics, Sorted by: Placing, Nr. of QSOs, CW QSOs, SSB QSOs, DXCC, HQ, Radio, Software.
WRTC Station Statistics.xlsx
Microsoft Excel-Dokument [64.1 KB]
Pretty Much Everything
WRTC-2018 Complex Statistics.xlsx
Microsoft Excel-Dokument [83.6 KB]
COMMENTS:
Most of the sheets are self-explaining.
RADIOs:
It was difficult to sort by radios because there were many combinations.
As you will see, they are grouped by
- 2x "Same Radio
- Mixed Brands
- 2x "Same Brand, Mixed Models"
Although the most often used combination of radios was 2x K3, the winning team used 2x Yaesu FTdx-5000. A couple of teams used 2x FLEX, a few more used a FLEX with a traditional radio.
Interesting, one team was using an TS-850 and placed 4th.
SOFTWARE:
Once again the most often used Logging Software was WinTest (28x), with N1MM placing a close second (25x).

N E W

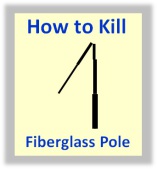
A Short Video by W8JI
N E W
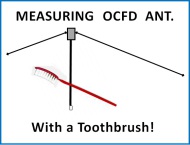
OCFD ANTENNA
PRESENTATION

( Info-Only; NO SALES! )
Spiderbeam on Facebook:

BRAND NEW
from Spiderbeam:
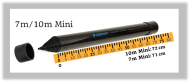
Mini "SOTA" Pole
by Rob Sherwood NC0B
(AUF DEUTSCH)

Spiderbeam FG Pole
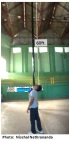
Photo: Nischal Nethrananda
A fun film about
Ham Radio Outdoors
(not just in Tenerife)
(English & German)
(nearly) Invisible Pole
An Aerial-51
Sponsored Expedition:
INTRODUCING
Special purpose Aerials:
Ultra-Lightweight antennas for expeditions and stealth applications.
+
(other)
---------------------
UPDATES:
|
|
-----------------
LL-TUNER "S-MATCH"
added to my
symmetrical tuner page.
----------------------
PROGRESSING:
LOTS OF NEW CONTENT IN THE SECTION:


Since JAN-2013
*******************