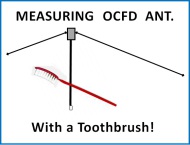
Measuring OCFD Antennas with a Toothbrush
SILLY as this may sound, I commonly find many people doing this!
When trying to understand what we see when examining measurements of an OCFD antenna, it is very important that we take enough measurements on each band to give us a realistic and accurate view of the antenna.
For many years, the ‘defacto standard’ antenna analyzer used by hams was the MFJ-259B.
This was a wonderful device and I can’t imagine being without it.
However, it has one major disadvantage when used to measure OCFD antennas:
it cannot scan the entire band at once.
As a result, for each frequency within a band that we wish to examine, we must make a separate measurement. Scanning analysers need make only one measurement to scan the entire band.
For instance, using a 1 MHz scan bandwidth, my RigExpert AA-54 takes a measurement every 10 kHz within all hf hambands except 10m. On ten meters I use a 3 MHz scan bandwidth.
So what? What’s the advantage?
Figure 1 below shows two identical 40m OCFD antennas with 4:1 Guanella baluns. B5 uses a single-core, B6 a dual-core balun. With 100 Watts of RF applied through a half wavelength of coax, the measured CMC on the feedline (at the radio) is nearly 6 times higher with the single core balun.
More important, please look carefully at the shape of the curves.
Whereas the antenna with the dual-core balun exhibits a typical dipole-like SWR curve (i.e., SWR rising more rapidly below SWRmin, and rising a bit slower above SWRmin), the antenna with the single-core has a more flattened out curve. This distortion of the shape of the SWR curve is due to Common Mode Current on the feedline.
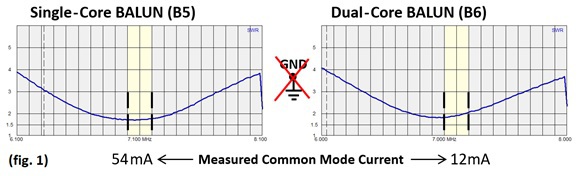
If you are just taking 3 or 4 SWR measurements across the band with the MFJ-259B, you would probably not notice anything. Using a scanning analyzer, you would immediately “see” that there is CMC on the feedline.
NOW THE TOOTHBRUSH
When I was drafted into the US Army nearly 50 years ago, like all new soldiers I had to go through basic training. AND, Rick being “Rick”, was often punished by having to scrub the latrine (bathroom) floor with a toothbrush.
Eventually I managed to get the entire floor clean, but it took a lot longer than it would have taken if I had been using a large scrubber-brush.
Measuring OCFD antenna bands with an MFJ-259B (or any other non-scanning analyzer) and taking enough measurements to glean all of the information we need to properly analyzer the antenna, is much like cleaning the latrine floor with a toothbrush.
But that’s not all . . .
Here is another example, where I skewed the feedline to create somewhat of a worst-case condition:
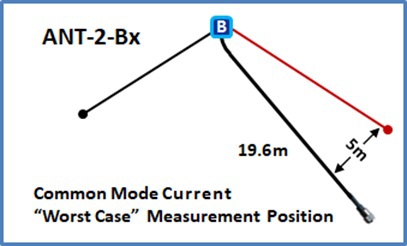
Granted, this is a very stupid idea, but sometimes the surroundings of the antenna leave us no alternative. As Forest Gump's mom said:
We just have to play the hand the Good Lord gave us!
Figure 2 below shows just how bad it can get:
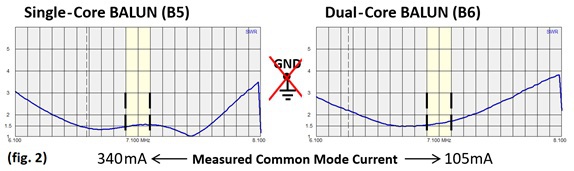
The curve with B6 is now skewed too… indicating CMC on the feedline, but most likely you would not catch this if taking just 3 or 4 measurements with a 259B.
B5 is a bloody disaster. Experienced hams might catch this with a 259B, but unexperienced hams might just think the antenna is great!
And for the Grand Finale
Just for fun, let’s add a good Maxwell choke to the coax of our worst case scenario, just before it connects to the transmitter.
Figure 3 shows the results:
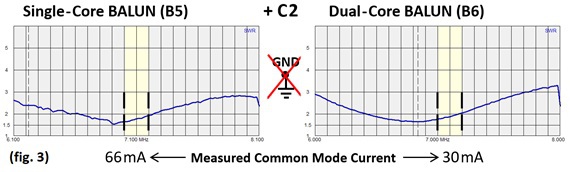
With B6, most of the CMC has been eliminated and the curve looks nearly normal again. If you look closely, you will see it rising too fast on the upper side. Clearly the dual-core 4:1 Guanella balun is challenged here in this worst-case scenario . . . but it will probably work OK. A DJ0IP Hybrid Balun would be better in akward situations like this.
With B5, there is more than twice as much CMC on the line and although the ultimate SWR level is almost normal, the jagged shape of the curve clearly shows that there is something rotten in Denmark! You see this immediately with a scanning analyzer. You would miss this when measuring with an MFJ-259B.
KEEP THE TOOTHBRUSH OR THROW IT AWAY?
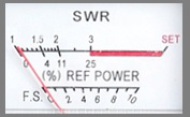
By all means KEEP IT. I will not part with my MFJ-259B and its analog meter. For many measurements, using the analog meter is much easier/better than using a bar graph or digital display.
But for measuring OCFD antennas,
the scanning analyzer wins hands down!
NOTE: ALL GRAPHS ABOVE were created when doing the final analysis at the end of my 2012/2013
Common Mode Current Field Test on 40m OCFD antennas.
This is real MEASURED data, not somebody’s modeled data.

N E W
OCFD ANTENNA
PRESENTATION


( Info-Only; NO SALES! )
Spiderbeam on Facebook:

BRAND NEW
from Spiderbeam:
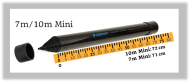
Mini "SOTA" Pole
by Rob Sherwood NC0B
(AUF DEUTSCH)

Spiderbeam FG Pole
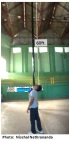
Photo: Nischal Nethrananda

A fun film about
Ham Radio Outdoors
(not just in Tenerife)
(English & German)
(nearly) Invisible Pole

An Aerial-51
Sponsored Expedition:
INTRODUCING
Special purpose Aerials:

Ultra-Lightweight antennas for expeditions and stealth applications.
+
(other)
---------------------
UPDATES:
|
|
-----------------
LL-TUNER "S-MATCH"
added to my
symmetrical tuner page.
----------------------
PROGRESSING:
LOTS OF NEW CONTENT IN THE SECTION:


Since JAN-2013
*******************