Spiderbeam SWR Curves
EVALUATING A SPIDERBEAM'S SWR
In order to determine if a Spiderbeam is working properly, you need to see what the SWR of the antenna is across all five bands. The best way to do this is to use an antenna analyzer with a scanning function, such as one of the RigExpert analyzers.
If you don't own or have access to one of these analyzers, no problem, just take a lot of measurements and record them. It is best to measure these with an analyzer such as the MFJ-259B, but you may also do it with your transmitter and an SWR bridge.
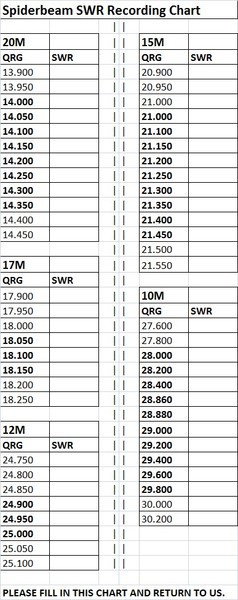
The chart on the right shows you the range of frequencies you should measure "if you can".
NOTE: The chart begins below each band's bottom end and ends above each band's top end.
CAUTION: DO NOT TRANSMIT OUTSIDE OF THE BAND.
If you do not have an analyzer, then you will have to limit your tests to those frequencies within the ham bands (Shown in BOLD).
Once this chart has been filled in, it is much easier to understand exactly what is happening with "your" Spiderbeam.
DOWNLOAD this chart below - bottom of page.
SCANNING WITH AN ANALYZER
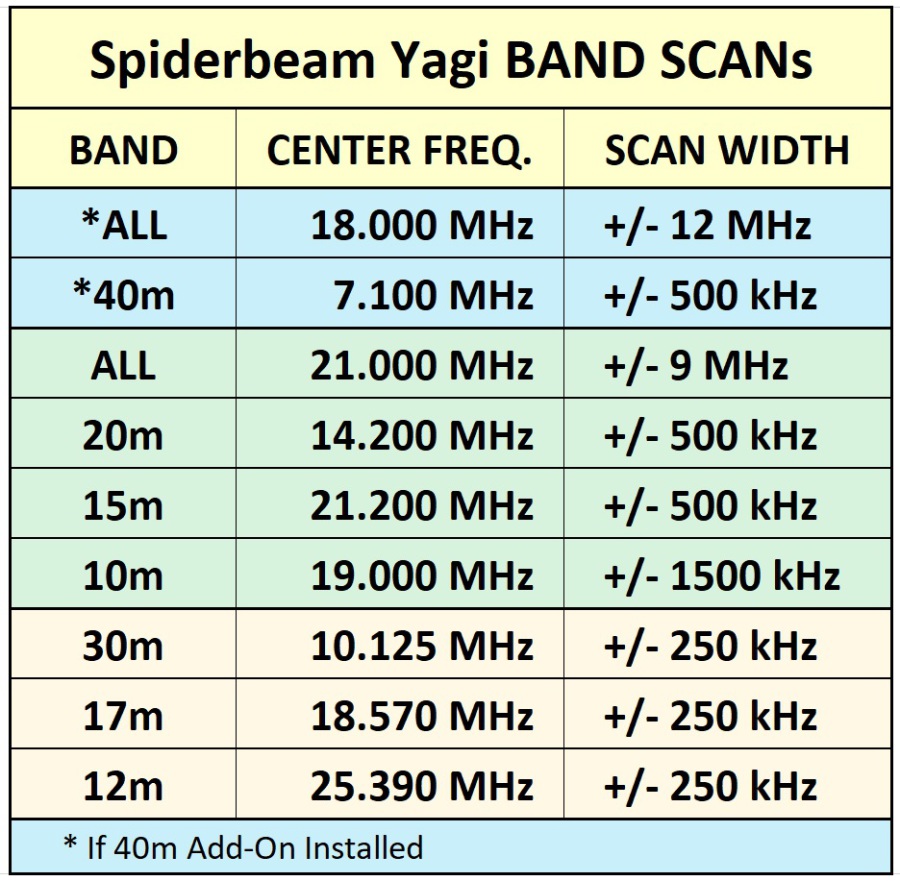
We need one scan for each band.
The parameters of each scan are shown in the chart on the right. Place the center frequency as shown in the chart, and use a 1 MHz Scan Width for all bands except 10m. On 10m use a 4 MHz Scan Width.
If you are using a RigExpert analyzer, save the 5 scans as data files, then zip them together and send us the single zipped file. We can evaluate it using ANTscope.
DOWNLOAD instructions for using the RigExpert AA-54 Antenna Analyzer to perform these scans, and information about using AntScope below.
Additional SWR Information:
Most of the time the Spiderbeam will work "right out of the box". By this I mean it will work with the dimensions shown in the Construction Guide.
The Spiderbeam is very BROAD-BANDED.
Some people like to prune the antenna a little to center the point of lowest SWR in the band segment of their choice, but in reality this is usually not necessary. The Spiderbeam is broadbanded so it won't really matter much if you move the SWR up or down the band, unless you have a transceiver that begins folding back power even at low SWR levels.
BEST PRACTICE:
After you have finished building and assembling you Spiderbeam, you should temporarily raise it to a height of about 6 to 10 feet and measure the SWR across all bands. Make sure the antenna is working correctly BEFORE raising it to its final height.
At this height (5 to 10 ft.) you will be able to see the SWR "trend" of your antenna. Of course when you raise it, the resonant frequency is going to increase.
HOW MUCH DOES THE RESONANCT FREQUENCY INCREASE
WHEN YOU RAISE IT TO FULL HEIGHT?
We have a standard answer to this question, but as you can imagine, nobody on the planet can predict exactly how much it will rise at "your" QTH. It depends on many factors which differ from one QTH to another.
In General, expect the resonant frequency on each band to rise about 100 to 200 kHz.
Most of the time this will be close enough. But there are places where it may be different.
While living in Oklahoma where we had very dry earth, raising my Spiderbeam from 10 ft. to 33 ft. made only abut 50 kHz difference, but that is the exception. Indeed in Oklahoma, you can lay a dipole on the ground and easily work QSOs with it. In most other places on the planet it would only be a dummy load! So don't be alarmed if you see a different value at your QTH.
The best case is to tune it as we have said (at 10 ft.), then raise it and measure again, taking the time to fill in the chart shown above and downloadable below.
WORST CASE:
If you have absolutely no chance to easily raise and lower the antenna whenever you like (i.e. you are using a crane to put it up and it costs $300 every time you take it down), then:
CUT IT TO THE LENGTHS SHOWN IN THE MANUAL and just use it like that!
DOWNLOADS (Manual Measurements):
This document is a chart for recording measured SWR results of your antenna across 5 bands. It is an Excel spreadsheet. If you are unable to work with this format, email to: Info@Spiderbeam.com .
Spiderbeam SWR Chart_93_2000_Compatibili[...]
Microsoft Excel-Dokument [29.5 KB]
This file is for people who do not have Microsoft Excel. Fill in this chart, and if necessary scan it and send to Spiderbeam Tech Support when requesting help.
Spiderbeam SWR Chart.pdf
PDF-Dokument [66.3 KB]
DOWNLOADS (Scanning Measurements):
This document shows how to measure a Spiderberam Yagi Antenna with the AA-54.
Measurements Using AA-54.pdf
PDF-Dokument [189.2 KB]
This document shows how to upload the individual data files from the AA-54 Analyzer, how to store them, and how to call them back up to work with them.
Using AntScope.pdf
PDF-Dokument [1.5 MB]

N E W

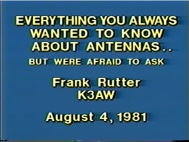
A Short Video by W8JI
N E W
OCFD ANTENNA
PRESENTATION


( Info-Only; NO SALES! )
Spiderbeam on Facebook:

BRAND NEW
from Spiderbeam:
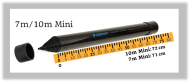
Mini "SOTA" Pole
by Rob Sherwood NC0B
(AUF DEUTSCH)

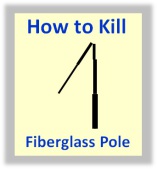
Spiderbeam FG Pole
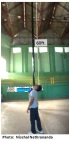
Photo: Nischal Nethrananda
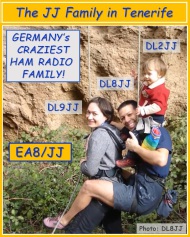
A fun film about
Ham Radio Outdoors
(not just in Tenerife)
(English & German)
(nearly) Invisible Pole

An Aerial-51
Sponsored Expedition:
INTRODUCING
Special purpose Aerials:

Ultra-Lightweight antennas for expeditions and stealth applications.
+
(other)
---------------------
UPDATES:
|
|
-----------------
LL-TUNER "S-MATCH"
added to my
symmetrical tuner page.
----------------------
PROGRESSING:
LOTS OF NEW CONTENT IN THE SECTION:


Since JAN-2013
*******************